
Photo by freestocks.org on Unsplash
Our experience with code has taught us that platform optimization plays a crucial role in grabbing and retaining a customer base – essentially creating your market share. Ship a half-baked app and customer loyalty is immediately affected. Ship a polished, seamless, airtight experience and they’re yours to keep.
Whether you sell physical goods or services, online or offline, it helps to know what devices people own. Smartphones and tablets have become de-facto platforms for ad delivery and shopping, and marketers everywhere strive to deliver a compelling viewing experience on these gizmos.
Device ownership heavily determines the way people spend their time, whether it’s for business or pleasure. Different devices have different attributes (i.e. how people use them and engage with the material they provide). Therefore, the social and cultural implications of device ownership are vast, as are some political and macroeconomic aspects as well. The statistical makeup of owners can vary widely for each type of device, but it’s not difficult to see who is using what, when, and where if you know where to look.
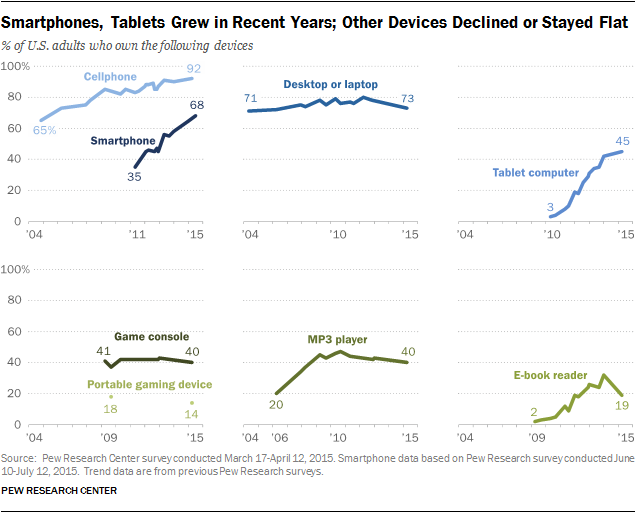
The Demographics of Device Ownership, courtesy of Pew Research Center, offers a bird’s eye view of the platforms used by different demographics, aiding marketers in their quest to optimize their offerings and target just the right age group, sex, race, social status, etc. Some highlights from the findings*:
- 68% of Americans have smartphones, 45% have tablets, and ownership of other forms of “computers” has not grown in recent years
- 68% of U.S. adults have a smartphone, up from 35% in 2011
- tablet computer ownership has edged up to 45% among adults
- 86% of those ages 18-29 have a smartphone
- of those ages 30-49, 83% own a smartphone
- of those living in households earning $75,000 and up annually, 87% own a smartphone
- e-readers are losing their edge, with only one in five adults owning one (down from a third / 32% in 2014)
- mp3 players are surprisingly still holding up (40% ownership among adults), despite every smartphone boasting a built in music/video player
- among those 18-to-29 years-old, mp3 player ownership is higher (51%), but considerably lower compared to 2010, when 51% of those in the same age group carried a dedicated media player in their pocket
- 78% of adults under 30 own a laptop or a desktop, down 10 points from the 88% in 2010
- 40% of adults report having a game console, the same as five years ago
- 14% of adults own a portable gaming system, such as PSP/PS Vita or NDS (Nintendo DS) – the share of portable consoles has been dwindling at an alarming pace ever since the emergence of Apple’s and Google’s app stores
Most, if not all of the falling numbers reported in this survey can be pinned on a single suspect: the smartphone. The versatility and increasing performance of this Swiss army knife for connecting with the world has chipped away at the share of virtually every other platform out there. If there’s one screen that begs to have your product optimized, it’s this one. Full findings in the original report.
*Data gathered from two separate surveys conducted by Pew Research in the United States this year among a national sample of roughly 4,000 people
Post A Reply